
This page shows the Covid-19 case data for all of the intermediate zones in Argyll & Bute, and also for Arran. It will be updated each Thursday, by 5pm.
When the page is updated, it will show the most recent weeks data, which will be for the week up to the most recent Friday. So, for example, if this page is updated on Thursday the 16th of June, then it will show how many new people tested positive in the week up Friday to the 10th of June.
The data is based on specimen date, so it isn’t just how many new cases were reported during that week, but it is how many people took a test during that week, which turned out to be positive.
Please be aware that if a zone has had only 1 or 2 new cases in a week, then this data is suppressed due to confidentiality issues, and the zone will just display as 0.
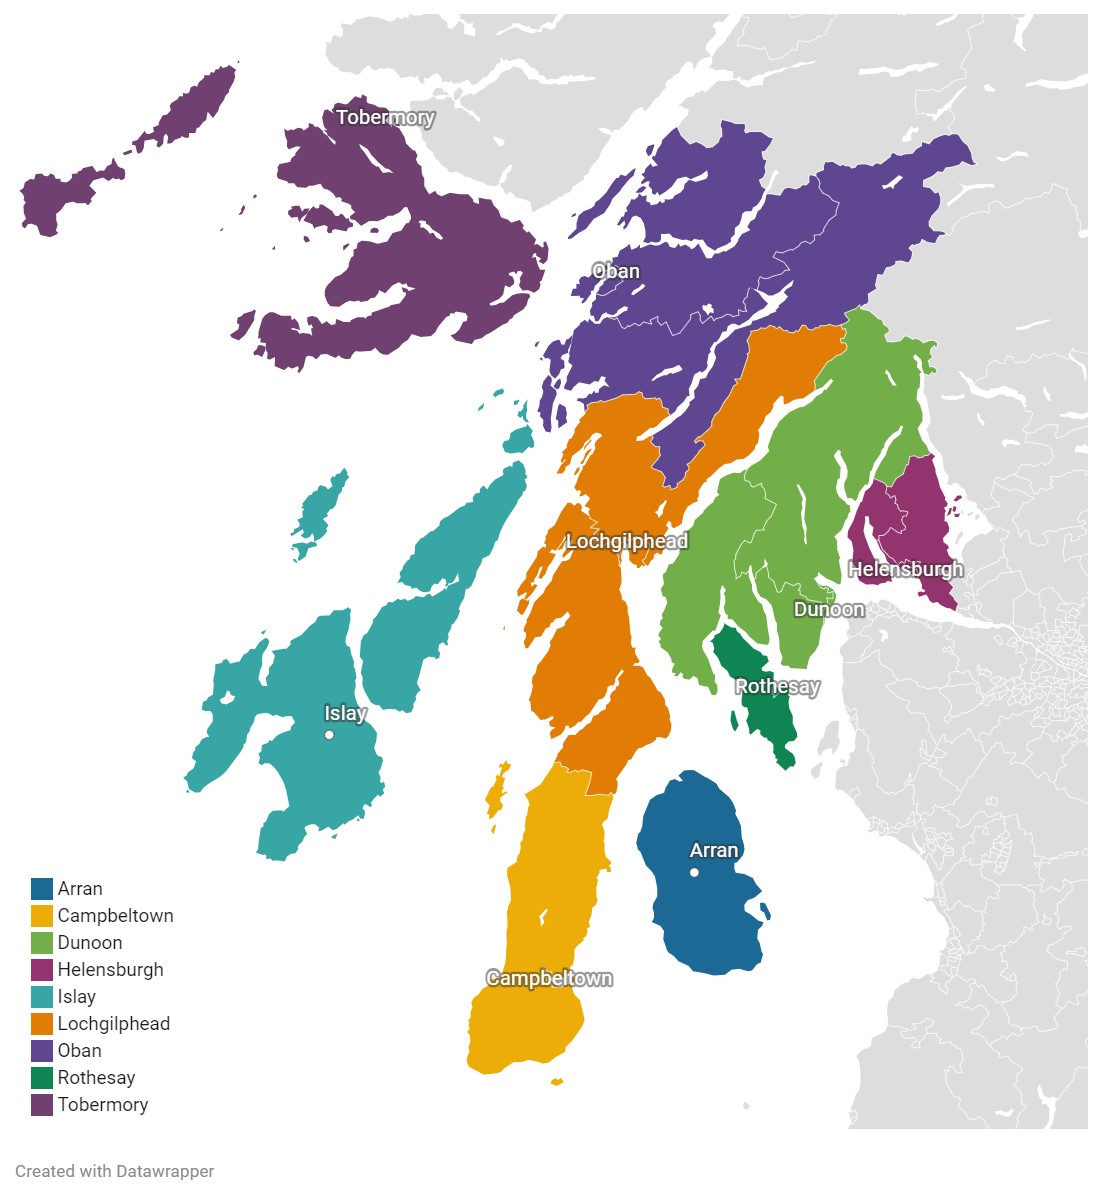
Several of the charts on this page group the intermediate zones into ‘Regions’. These are based on the nine Argyll College regions, and are as below:
Arran: Arran
Campbeltown: Campbeltown / Kintyre Trail
Dunoon: Cowal North / Cowal South / Dunoon / Hunters Quay
Helensburgh: Garelochhead / Helensburgh Centre / Helensburgh East / Helensburgh North / Helensburgh West and Rhu / Lomond Shore
Islay: Whisky Isles
Lochgilphead: Greater Lochgilphead / Knapdale / Mid Argyll
Oban: Benderloch Trail / Loch Awe / Oban North / Oban South
Rothesay: Bute / Rothesay Town
Tobermory: Mull, Iona, Coll, and Tiree
Please see the bottom of this page for some additional information, and a message box where you can get in touch with any questions or suggestions!